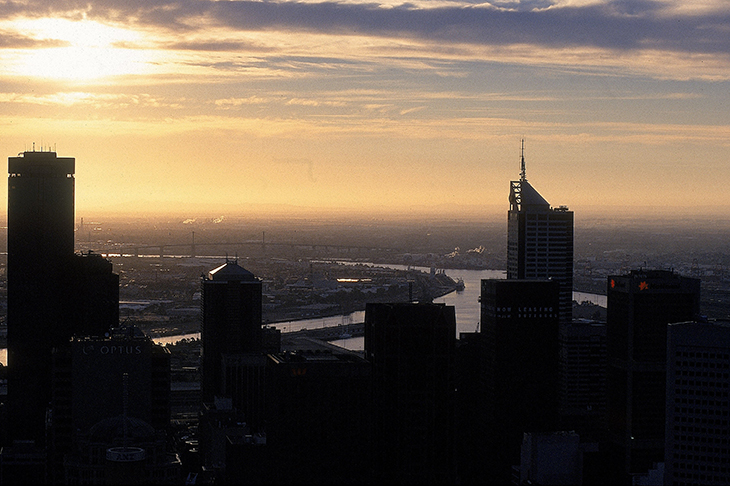
The city of Melbourne has one of the longest surface-temperature records for anywhere in Australia, stretching from 1856 to the present day and utilising only four sites. From 1908 until 2013 the series’ measurements were taken at the junction of Victoria and La Trobe Streets when it was replaced by a site at Olympic Park (which began measurements in 2013).
In a process referred to as homogenisation the Bureau of Meteorology (the Bureau) makes adjustments to the actual measurements in the development of the official record (known as ACORN-SAT) which, in turn, is used to determine long-term climate trends. One justification for data homogenisation is that cities are significantly warmer than surrounding areas due to what is known as the urban heat island (UHI) effect.
In the case of Melbourne, however, the Bureau’s adjustments are in the wrong direction if the purpose is to make the official record more homogenous, and to compensate for the effects of urbanisation. I will argue that the unadjusted raw maximum summer temperature as measured at Melbourne gives the best indication of long-term temperature change. This is calculated as an increase of 0.3 °C per century for the period 1856 to 2015, in contrast to the comparable series of homogenised ACORN-SAT data which shows a rise of 1.0 °C per century from 1910 to 2016.
The Bureau produces daily minimum and maximum temperatures, these temperatures occurring at different times of the day from an atmosphere that is in very different states. The minimum temperature is subject to anomalies in the surface boundary layer of the atmosphere, which reflects local influences. The maximum temperature is from a large spatial volume of air and the presence of solar radiation that results in convective mixing of the atmosphere.
In the Bureau’s maximum annual temperature series for Melbourne there is an apparent step-up in the temperature in 1996. Statistical analysis shows that two straight lines represent a better fit to the record than one straight line, with 98 per cent certainty, the temperature rise from 1856 to 1996 is 0.03°C per decade, while the break is a difference of 0.7°C.
The key point to note is that the maximum temperature break is coincident with the screening of the La Trobe weather station from summer southerly winds by the construction of the very tall City Gate building at 33 La Trobe Street, a fifteen-storey apartment tower completed in 1997. To its east is a further apartment building completed in 1998. The likely explanation for the 1996 increase is the screening of the site by the new buildings.
In order to calculate the UHI effect on Melbourne’s temperatures I was able to compare them with temperatures at Laverton, about 20 km to the south-west of the city centre, as the series are strongly correlated. The UHI effect in Melbourne is most clearly detectable in the minimum temperature measurements. The raw minimum temperatures from 1944 to the present as measured at Melbourne show an increase of about 2°C compared to an increase of about 1°C at Laverton.
An increase is also detectable in the maximum winter temperature at Melbourne, but is not seen in the summer maximum to a significant extent. The behaviour of the maximum temperature perhaps shows that there is a common spatial volume of the atmosphere covering Laverton and Melbourne, which would indicate that temperature maxima are not affected by urbanisation to the same extent as minima.
The Bureau makes changes to the temperatures as measured at the La Trobe Street weather station, and then incorporates these ‘adjusted’ values into the ACORN-SAT dataset. However the temperature should not be adjusted to an averaged value unless the area subject to the change is known and some weighting procedure produces an average temperature for a larger surface area.
The ACORN-SAT adjustments were made using an algorithm that considered neighbouring sites. I have determined, based on the information available from the Bureau, that some of these ‘neighbouring’ sites are more than 200 km from Melbourne, with Mount Gambier at 370 km and Larapuna (Eddystone Point) at 458 km on the north-east coast of Tasmania. It is difficult to see how such distant sites could be used to sense changes in the local Melbourne environment when a move of a few kilometres to Olympic Park drops the temperature 0.80°C.
The ‘adjustments’, moreover, are in the wrong direction to remove UHI anomalies. For example, the Bureau adds 0.41°C to all temperatures as recorded at the La Trobe Street site before 1990. So, the adjustments have the effect of increasing past temperatures, rather than lowering the more recent temperatures. Clearly these adjustments do not compensate for the urban warming, but rather increase Melbourne’s mean temperature.
If Melbourne’s temperature is to be used as an indication of long-term global change, then the maximum temperature in summer would give the best indication. This is because local temperature anomalies, such as the UHI, are not significantly affecting the record – at least not until 1996 at the La Trobe Street site.
Using a time series which ignores the 1997 to 2013 data from the La Trobe Street site but includes the data from Olympic Park for 1997 to 2015, I calculate a rise in the summer maximum temperature at Melbourne of 0.03°C per decade for the period from 1856 to 2015, which is equivalent to a rise of 0.3°C per century.
This trend of 0.3°C per century aligns with trends at nearby sites unaffected by UHI, and is the same rate of change for south-eastern Australia described by Dr Jennifer Marohasy and Dr Jaco Vlok in their chapter in Climate Change: The Facts 2017, based on a series from 1887-2013. This is in contrast to the ACORN-SAT homogenised data – also referred to in that chapter – which shows an increase of annual maximum temperature of 1°C per century in Victoria (the difference being exacerbated by ACORN-SAT’s use of 1910 as the starting year for that series).
Got something to add? Join the discussion and comment below.
Get 10 issues for just $10
Subscribe to The Spectator Australia today for the next 10 magazine issues, plus full online access, for just $10.
You might disagree with half of it, but you’ll enjoy reading all of it. Try your first month for free, then just $2 a week for the remainder of your first year.


Comments
Don't miss out
Join the conversation with other Spectator Australia readers. Subscribe to leave a comment.
SUBSCRIBEAlready a subscriber? Log in