Predictions of the development of Covid-19 in Australia have not held up to even short-term scrutiny. For example, the Health Minister Greg Hunt stated on Insiders on the March 15 that the government’s best estimate was that the coronavirus will reach its peak in Australia in a “six-month window” although it “might be longer”. It actually reached its peak on the April 4 in relation to ‘active’ cases, and even earlier, on the 28th March for ‘new infections’.
On March 25, top epidemiologist Professor Tony Blakely stated that 60% of the population would become infected and 30,000 people would die, “if we are lucky”. At least the professor was talking about an assumed Infection Fatality Rate — IFR — of only 0.2%, at a time when the WHO were stating that it would be more than ten times that figure.
So, what does this mean in terms of how deadly Covid-19 actually is, and by extension, was the harsh Stage 3 lockdown necessary? Is it only with the benefit of hindsight that we can now determine that the Stage 3 lockdown measures were unnecessary or were there clear indications of this had anyone bothered to look carefully at the data in the days leading up to the lockdown. On March 27, I posted the following comment on Facebook:
[M]eanwhile, look at the almost insane overreaction (in Australia, new cases have plateaued….whilst we are still getting new cases the rate of increase is diminishing)….the idiots are now proposing Stage 3 lockdown measures when it is clear that we are getting on top of the [Covid-19] problem.
In the dying hours of March 30, Stage 3 lockdown was implemented, and while commentators have subsequently attributed the ongoing reduction in the rate of new infections after March 30 to the implementation of the measures, I would argue that one was not contingent on the other and that the continuing fall in new infections was simply the downward trend (in new infections) from the peak on or around March 28. In support of this argument, one only needs to consider the lag time between an infection occurring and it being recorded by the Health Department (6-10 days). As such, in reality, someone who became infected on March 30, when Stage 3 lockdown measures were implemented, wouldn’t realistically be identified and recorded as a ‘new’ infection until at the very earliest (and this being overly generous) April 4. Yet an analysis of the data for new infections between March 30 and April 4 indicates that the rate of new infections was diminishing, and this was prior to any influence from the Stage 3 lockdown measures; so, the new infections trend was on the downward curve without lockdown.
To further support my view, Professor Paul Glasziou, Director of Bond University’s Institute for Evidence-Based Health Care Medical experts, stated that any measurable outcomes from the Stage 3 lockdowns would likely not be identified until about April 10, with a clear inference according to the statistics in the chart below that the rate of new infections was well and truly on the downward trend without the implementation of Stage 3 restrictions. What one can clearly determine from the table is that my contention that the rate of new infections had already plateaued by March 28 was correct.
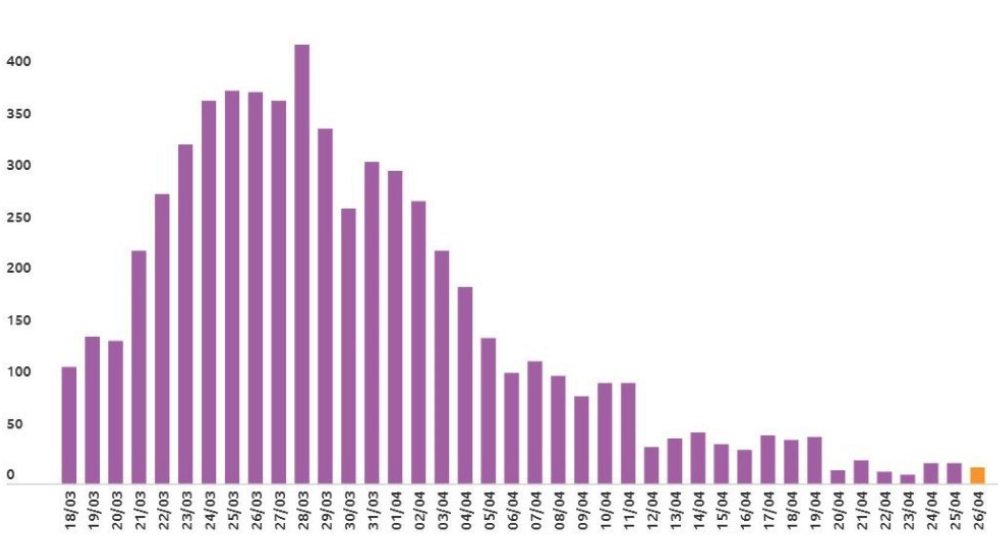
Number of New infections per day
To further highlight my argument that Stage 3 lockdowns were unnecessary, consider the second table, which indicates that the number of ‘active’ cases in Australia peaked on April 4, thereafter diminishing steeply.
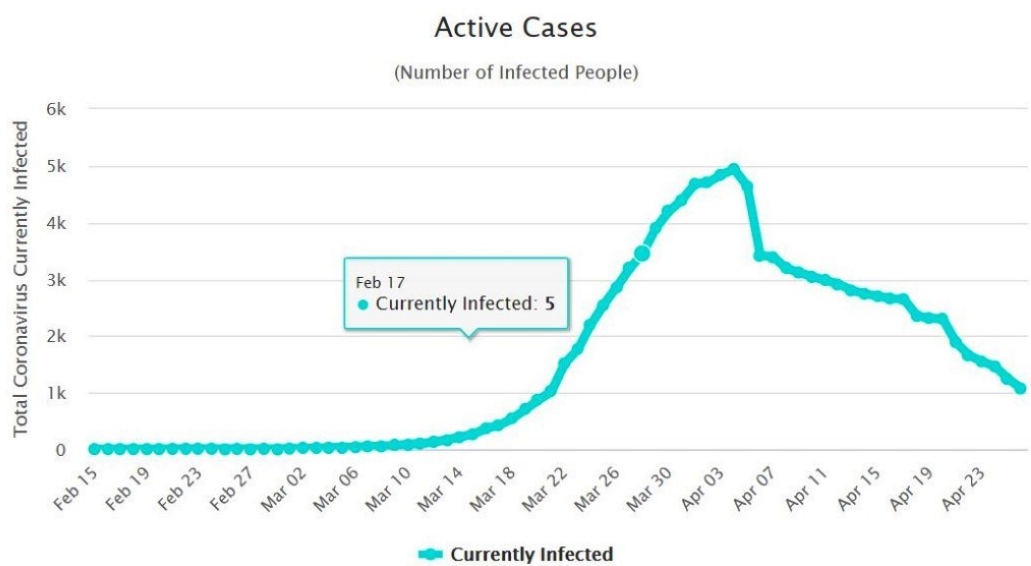
Number of active Covid-19 cases in Australia
If Stage 3 lockdown measures (implemented on March 30) had any efficacy one would not have expected to see ‘active’ cases diminish until around the 20th of April, considering the lag time — approximately three weeks — between infection, the occurrence of symptoms, diagnosis and recovery (when cases would not be active anymore). Whereas, the second clearly indicates that ‘active’ cases peaked on the 4th April and consistently fell after that, clearly supporting the contention that this was part of an already existing downward trend and not the result of Stage 3 lockdown restrictions.
Numerous antibody studies have found that the number of people that have been infected with Covid-19, but never diagnosed, far exceeds the number that have tested positive for Covid-19. Most of the studies indicate an IFR of about 0.1-0.2%, or about the same as bad seasonal flu.
The obvious difference between Covid-19 and seasonal flu is that communities have as yet been unable to develop a natural immunity to this new virus. In order for 60% of herd immunity to be attained, about 60% of the entire population would need to be infected. In contrast, with the flu, there is an existing natural immunity, bolstered by the availability of an annual vaccination program. The US Center for Disease Control and Prevention (CDC) states that between 2.5% and 15% of the population is infected by flu in any given flu season. In the 2017 flu season in the US 61,000 deaths were recorded with about 49 million people infected. If we extrapolate this to COVID-19, 60% of the population would give rise to 200 million infections and about 244,000 deaths in the US. In Australia, this would amount to around 12,000 deaths.
What these data indicate is that while we needed to be careful not to overload the hospital system, especially until we were able to collate and analyse data for the new disease, what has transpired in terms of Covid-19 is that early policies were not needed to specifically address the morbidity rate, simply because it is little different to that of the flu. As such, original policy measures rightly concentrated on ensuring that hospitals wouldn’t be overrun from higher rates of infection resulting from the lack of any herd immunity; and careful management would allow the government to “flatten the curve”. This was a well-enunciated goal. However, we have now determined that hospitals are not over-burdened, and even New York managed well despite its higher infection rates and its death toll. Australia has had ample opportunity to analyse the health imperative and manage any demand for increased capacity.
The more pressing problem now appears to be the mission creep that government has adopted, from the originally stated aim of ensuring hospitals were not swamped (by flattening the curve), to one where a clear objective is lacking and the public has been left with vague statements, none of which have been clearly defined.
The obvious question remains, why is it important to analyse and evaluate policy directives? While one can argue that the implementation of one policy over another may have very different implications for society, the policies imposed in Australia during the Covid-19 outbreak may well be viewed in hindsight as the most egregious in modern history; that is yet to be determined.
Aside from the yet to be pored over implications of the recent government lockdown policies (ostensibly to keep Australians ‘safe’) to do with democracy, due process, accountability and the notions of freedom that we would have normally enunciated as fundamental to who we are and what we stand for, there are more obvious significant downsides to the government’s lockdown; health as well as economic. Here I will quantify only two of the health effects relating to unemployment, both sets of numbers are taken from The Lancet. Before Covid, the unemployment rate was around 5%, it is projected (probably optimistically) to go up to 10%. That is a 5% increase. According to the Lancet, for every 1% increase in unemployment, there is a 1% increase in suicides1. Australia has about 3000 suicides per annum, so that relates to an extra 150 deaths due to additional suicides alone, or about double the number of Covid deaths seen to date. Second, Australia has about 1600 deaths per year due to drug overdose. A study by the National Bureau of Economic Research finds that for every percentage increase in unemployment, there is an extra 3.3% of drug overdose fatalities. That is an extra 264 deaths. So, for that 5% increase in unemployment, that is another 400 odd deaths per annum from that factor alone, and that is without any consideration of deferred cancer (and other diagnostic) testing, delayed ‘elective’ surgery, and the real probability that government will be required to reduce spending in the post-coronavirus era, including that of drugs covered on the PBS.
As I have implied, this is not a zero-sum game, there are very distinct costs, both economic and health, all of which have to be weighed up against the Coronavirus specific health issues. It is the costs that arise from ill-considered policy directives that are not sufficiently addressed, and as other commentators have also suggested, these might well be far more serious than the threats from Covid-19. Maintaining restrictions that hamper normal economic activity could, in time and in hindsight, be viewed poorly by the community. What might have been a more sensible option in the first place, was to isolate the vulnerable demographics in our community (those over 65-70 and those with comorbidities), keeping them safe, whilst allowing an otherwise healthy population to go about their normal daily lives. In that way, the 60% number attributed to infection and herd immunity can be attained with very few deaths, supported by the data which suggests a morbidity rate commensurate with the flu.
Got something to add? Join the discussion and comment below.
Got something to add? Join the discussion and comment below.
Get 10 issues for just $10
Subscribe to The Spectator Australia today for the next 10 magazine issues, plus full online access, for just $10.


Comments
Don't miss out
Join the conversation with other Spectator Australia readers. Subscribe to leave a comment.
SUBSCRIBEAlready a subscriber? Log in